
Build custom dashboards
Create your own dashboards from a set of ready-made metrics, each with its own time period.
Custom dashboards let you put the numbers you check most on one page, like a wall-screen scorecard for the shop. They're part of Labs, Homeforce's early-access features, and are included on the Scale plan.
Turn on dashboards
The account owner turns Labs features on.
- Go to Settings → Labs.
- Turn on Custom dashboards.
Dashboards then appears in the sidebar under Insights. Anyone who can view reports can open and edit dashboards. If dashboards aren't turned on, the page says "Turn on Custom dashboards in Settings → Labs."
Create a dashboard
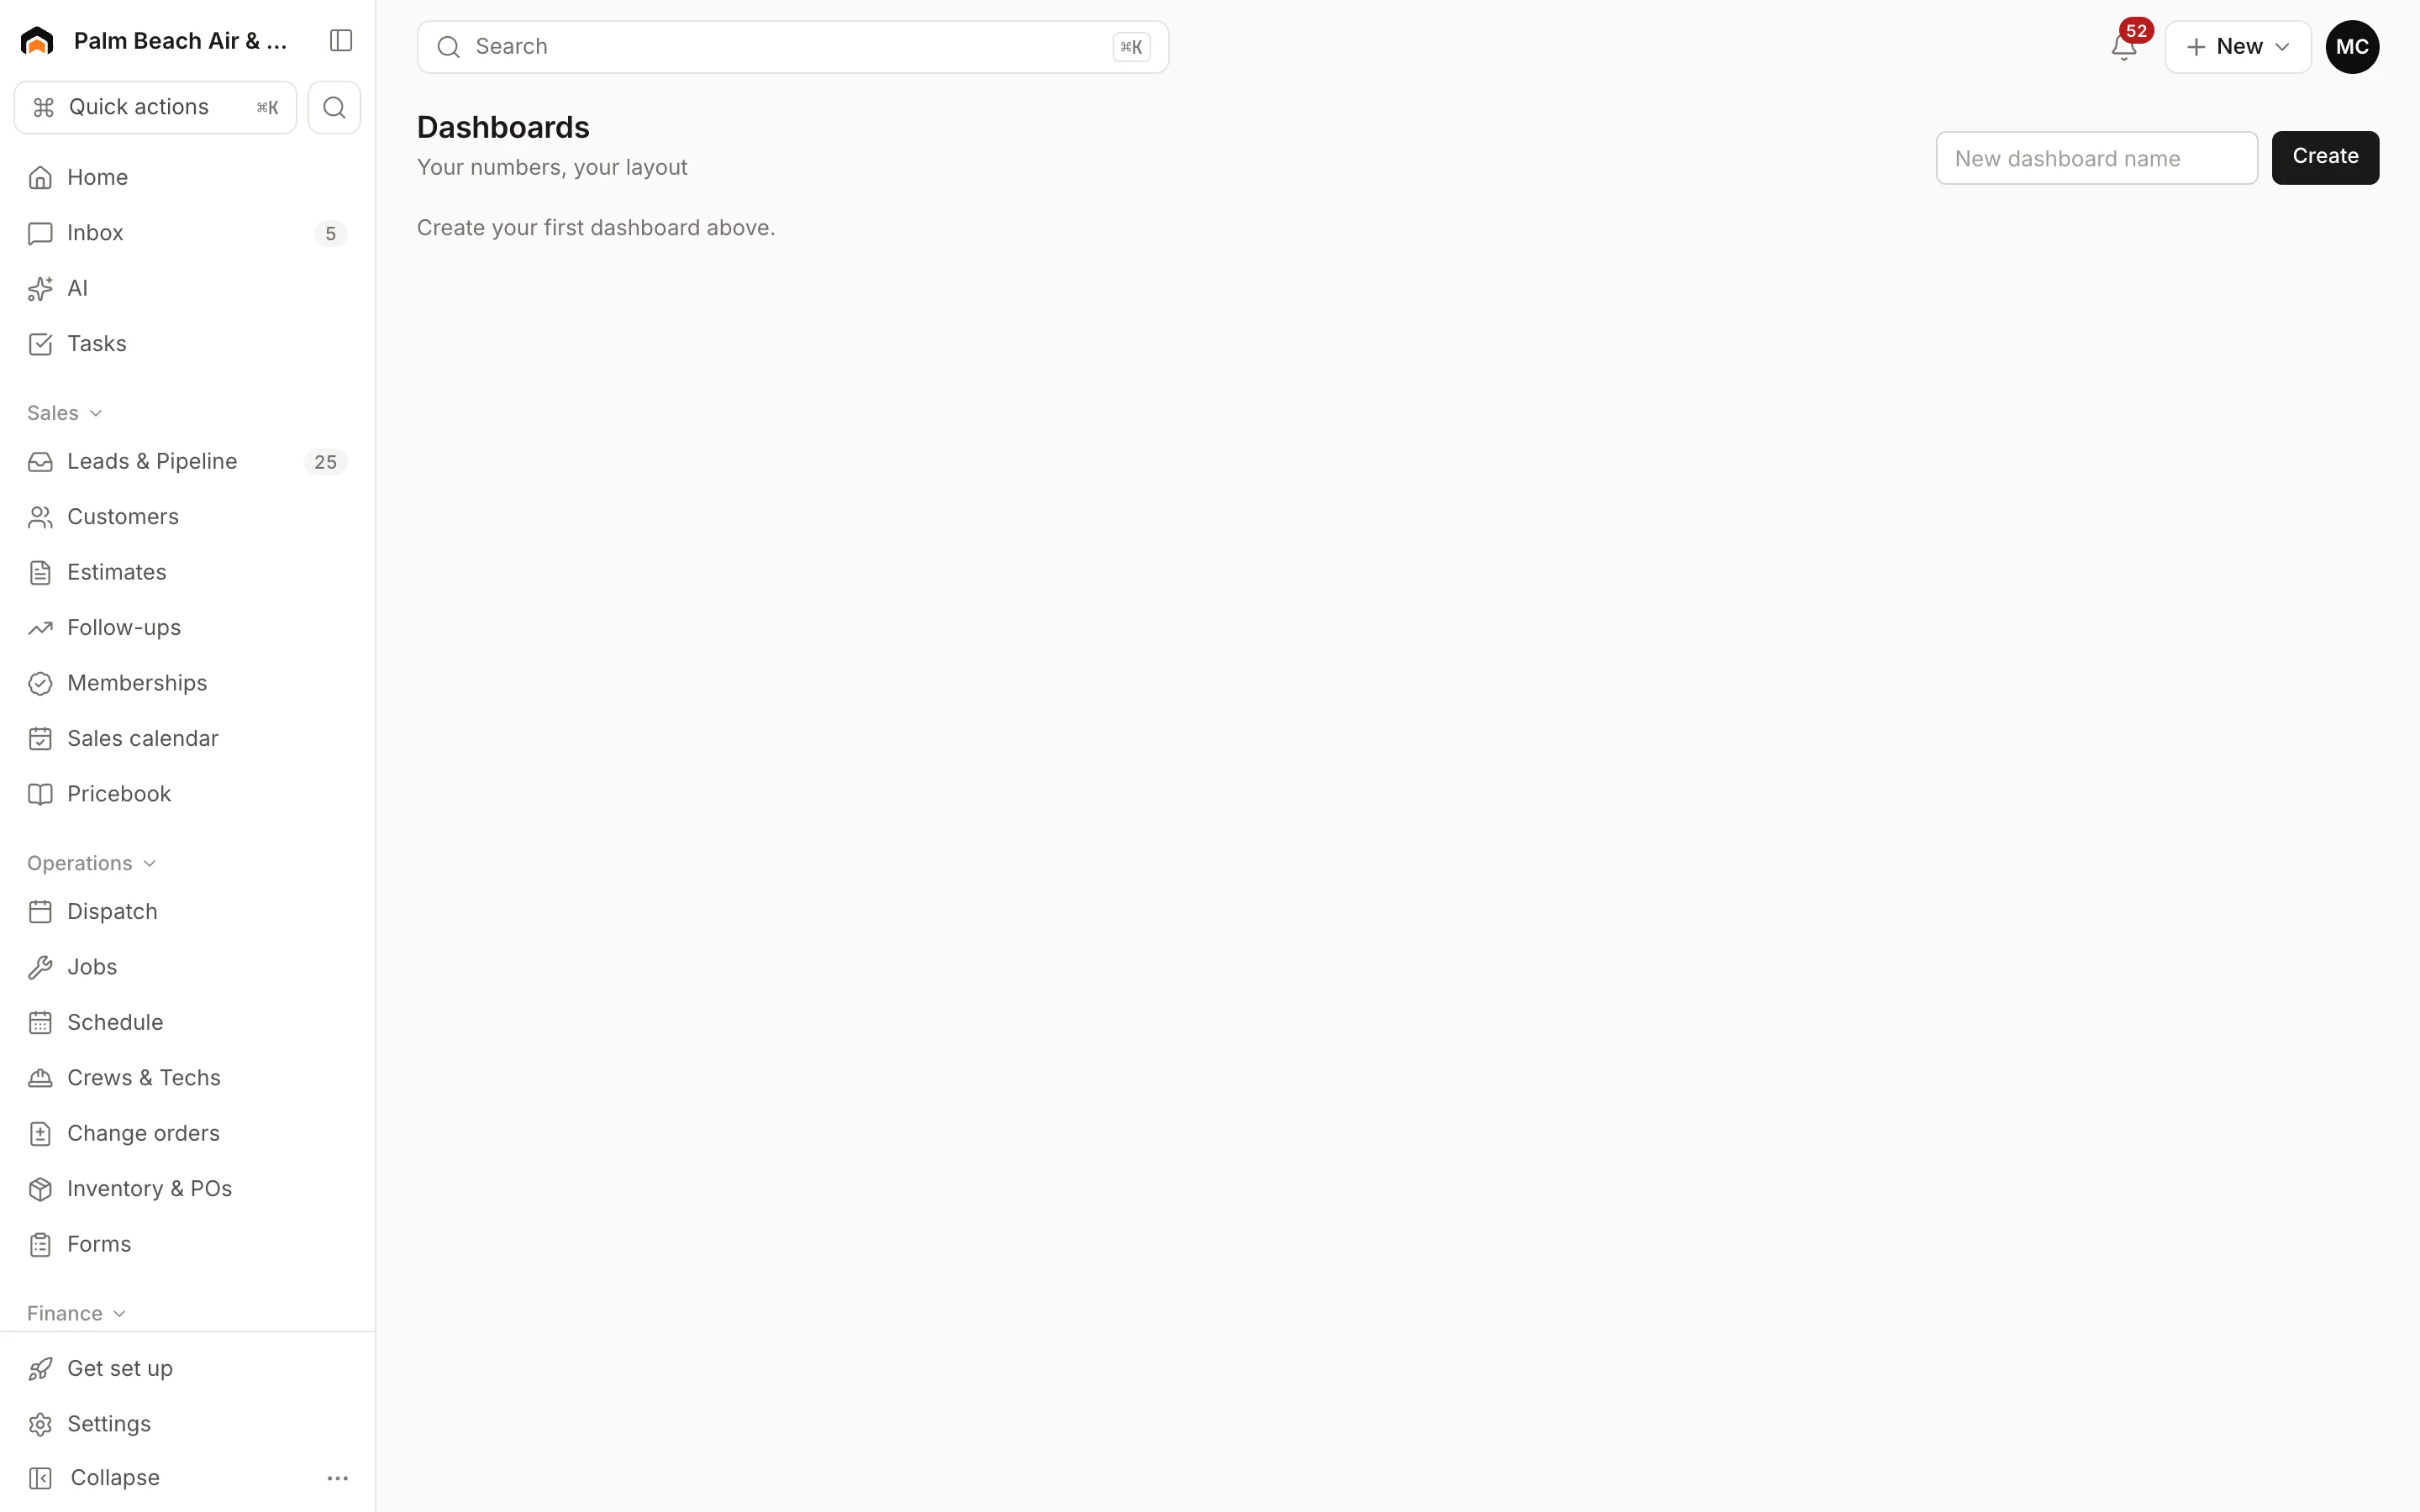
- Click Dashboards in the sidebar.
- Type a name in New dashboard name at the top (for example, "Monday meeting").
- Click Create.
New dashboards start with three widgets: Revenue collected, Jobs completed and Close rate, each over 30 days.
If you have more than one dashboard, switch between them with the buttons above the widgets. Dashboards are shared with everyone in your company who can see reports.
Add and remove widgets
- Under Add a widget, choose the Metric.
- Choose the Period: Today, 7 days, 30 days, 90 days or 12 months.
- Click Add.
To take one off, click Remove on the widget. A dashboard holds up to 24 widgets.
Available metrics
| Metric | What it shows |
|---|---|
| Revenue collected | Payments received, minus refunds |
| Invoiced | Invoices issued |
| Average ticket | Average invoice total |
| Jobs completed | Jobs finished |
| Close rate | Estimates approved out of presented |
| Outstanding receivables | What customers owe you now |
| Open estimates value | How many estimates are still waiting on a decision, with the top five listed |
| Active members | Active and past-due membership agreements |
| Leads by source | A list of lead counts per source |
| Revenue by tech | A list of revenue per technician |
These use the same calculations as the Reports page and the AI assistant, so the numbers agree everywhere.
Was this helpful?
Related articles
Reports
Reports overview
See revenue, invoicing, average ticket, close rate, team performance and lead source ROI for any recent period.
Reports
Use the Home dashboard
Read the KPI tiles, monthly goal, needs-attention list and schedule on the Home page, and view it as a team member.
AI agents
AI in Homeforce
Every AI feature in Homeforce, what each one does, who can use it, and what the AI can and can't do on its own.
Reports
Set monthly goals
Set a monthly revenue goal for Home, and record targets for sales, close rate, ticket size, leads and reviews.
Still stuck?
Our team answers support emails during business hours, usually within a few hours.