
Reports overview
See revenue, invoicing, average ticket, close rate, team performance and lead source ROI for any recent period.
The Reports page shows how the business is doing over a recent period: money in, work billed, sales results, who on the team is producing, and which lead sources pay off. Service calls and projects roll up together.
Anyone who can view reports can open it: owners, admins, office staff, salespeople, project managers and accounting. Techs can't. Click Reports in the sidebar.
Pick a period
Use the tabs at the top right: 7 days, 30 days (the default), 60 days or 90 days. Every number on the page covers that window, ending today.
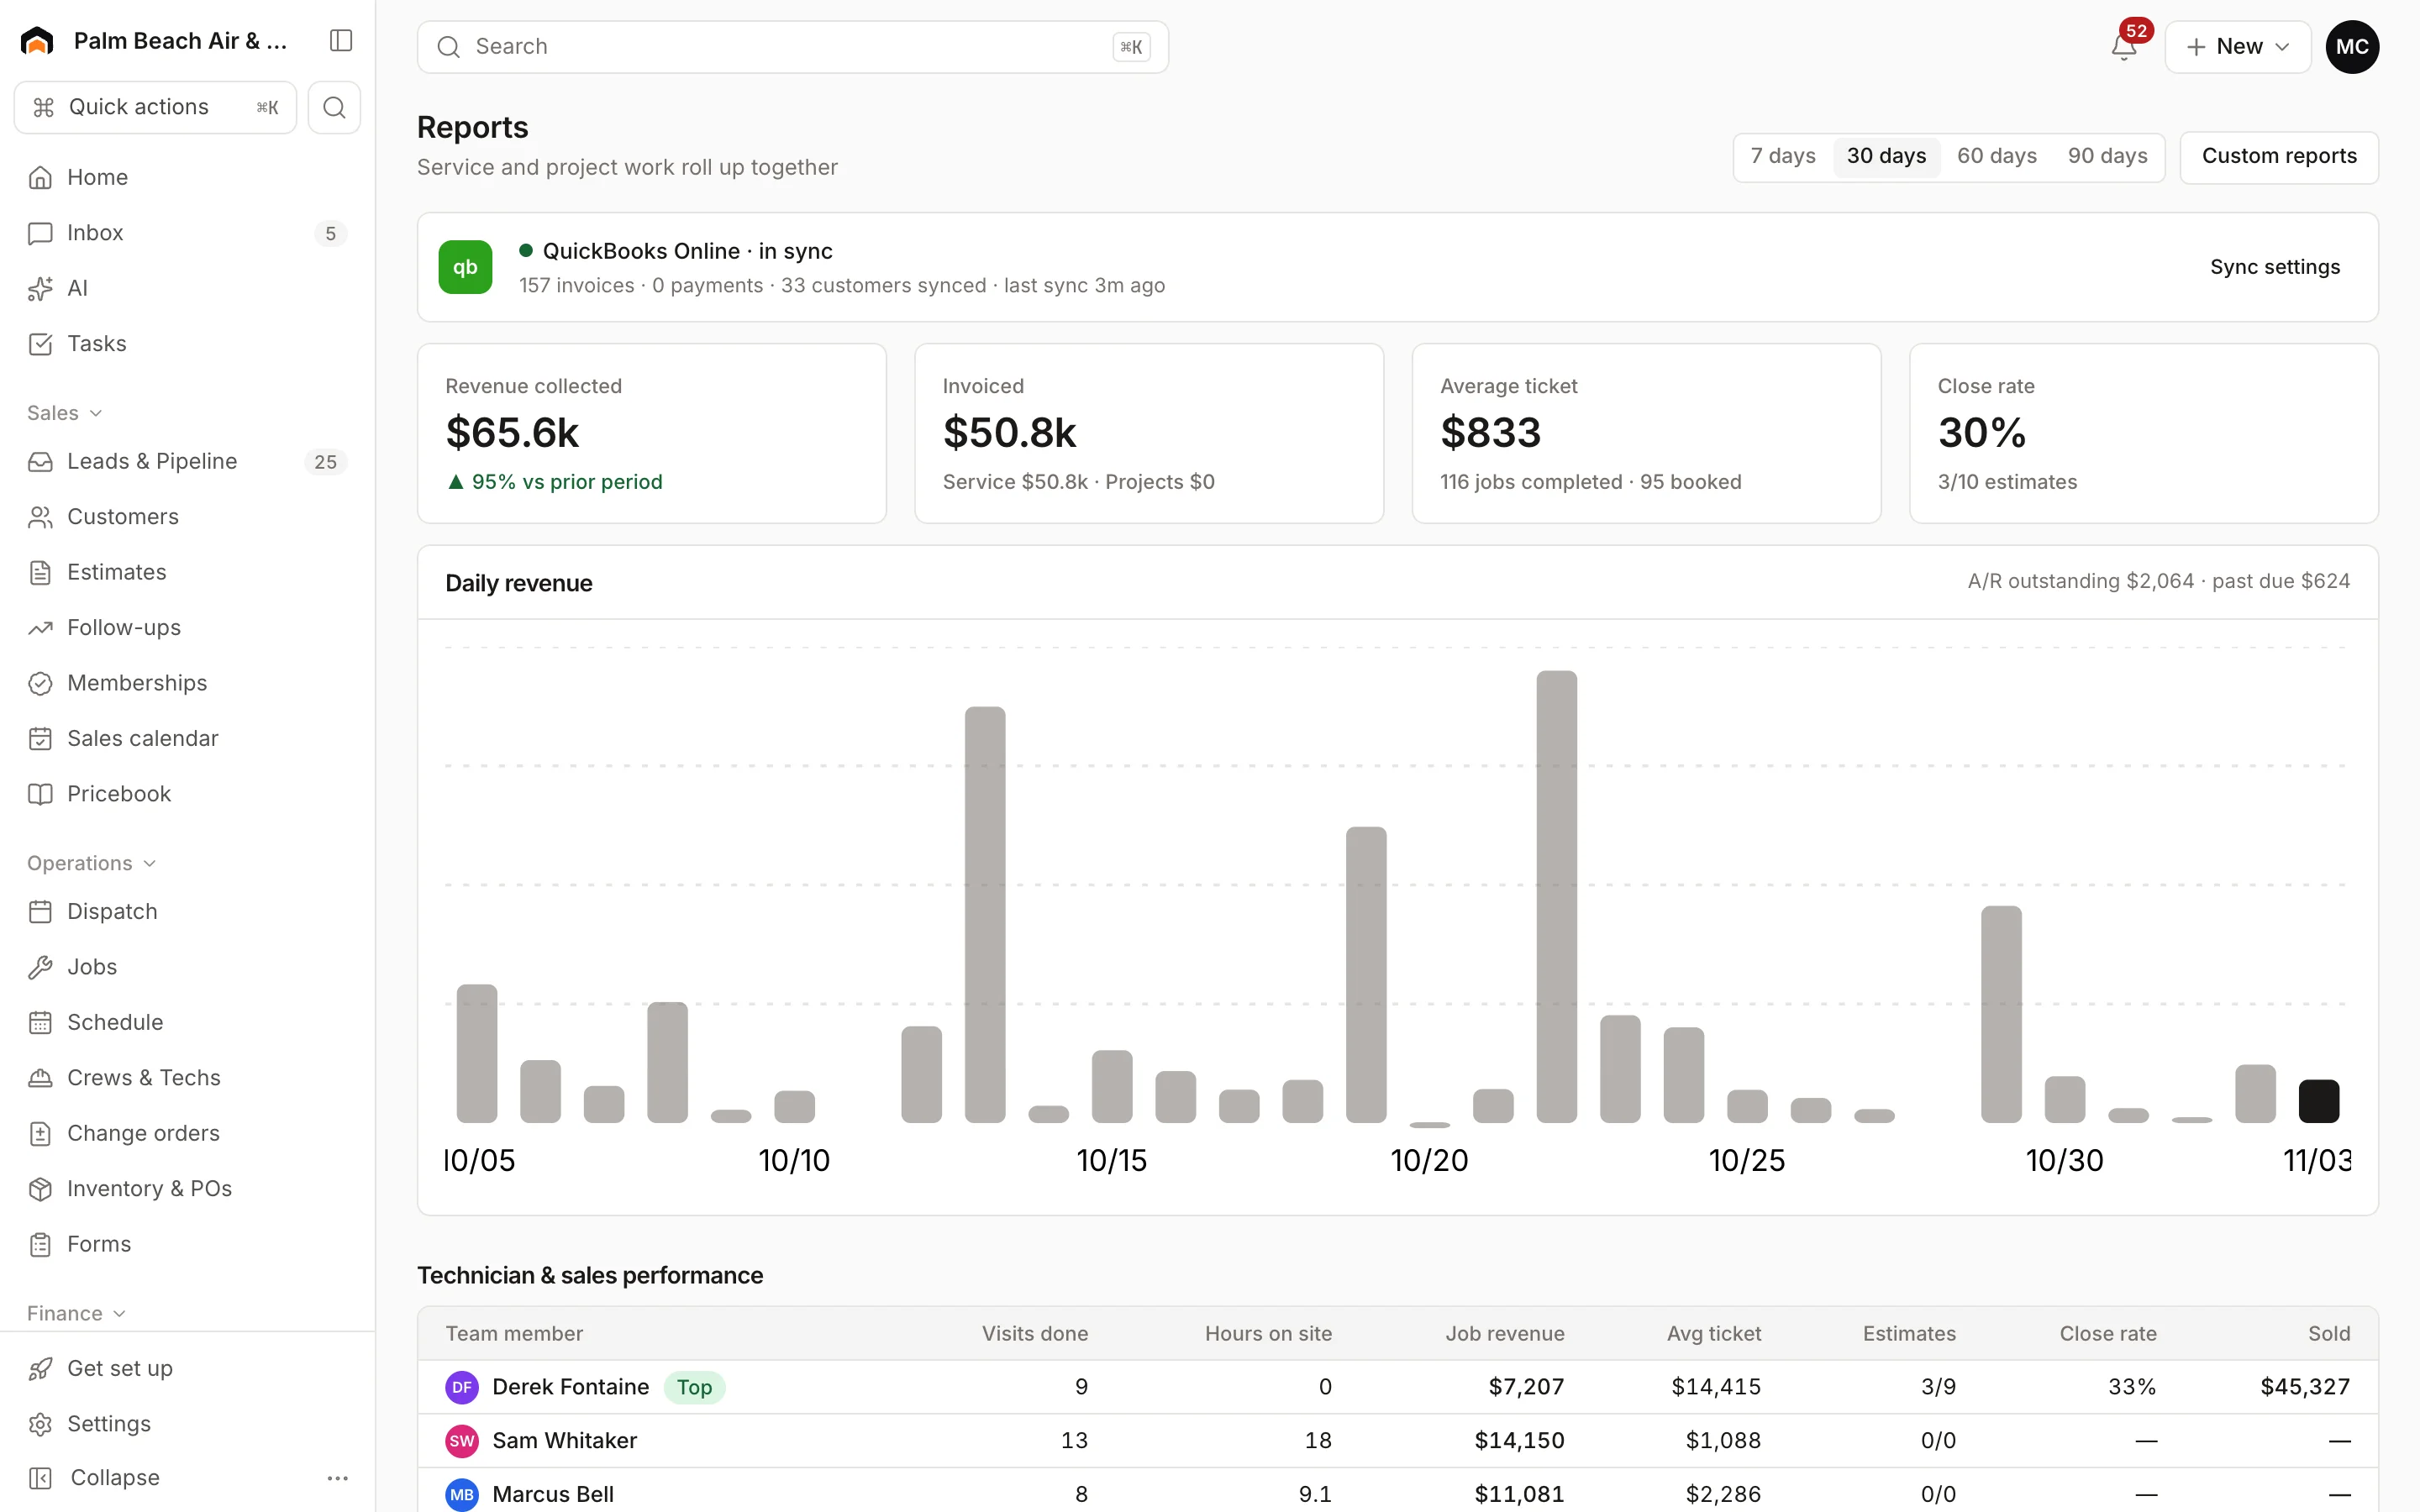
The headline numbers
- Revenue collected: payments received in the period, minus refunds. Pending bank payments and failed charges don't count. Underneath, the change versus the period just before it.
- Invoiced: the total of invoices issued in the period (sent, partial or paid; drafts, voided invoices and deposit invoices aren't counted), split into Service and Projects.
- Average ticket: the average invoice total in the period. Underneath: jobs completed and jobs booked.
- Close rate: estimates approved out of estimates presented (sent in the period).
Daily revenue
The Daily revenue chart shows payments collected each day. Above it, A/R outstanding is everything currently owed on sent and partially paid invoices, and past due is the part that's late. These two numbers are always as of today, not the selected period.
Technician & sales performance
A table of everyone who does field or sales work: visits done, hours on site, job revenue, average ticket, estimates won out of presented, close rate and total sold. The top performer is marked Top. See Team performance.
Lead source ROI
Each active lead source with its spend, leads, booked jobs, booking rate, cost per lead, revenue and return on ad spend. See Lead source ROI.
Related places to look
- Home shows your KPIs, monthly goal and what needs attention. See Use the Home dashboard.
- Job costing shows margin by job. See Job costing summary.
- Memberships shows active members and recurring revenue. See Set up membership plans.
- To work with the raw numbers in a spreadsheet, see Export your data.
Was this helpful?
Related articles
Reports
Use the Home dashboard
Read the KPI tiles, monthly goal, needs-attention list and schedule on the Home page, and view it as a team member.
Reports
Track technician and sales performance
See visits, hours, revenue, close rate and sales for each tech and salesperson, and how each number is counted.
Reports
Measure lead source ROI
See which marketing channels bring in leads, booked jobs and revenue for what you spend.
Settings
Import and export your data
See past imports, start a new one, and download your customers, jobs, estimates, invoices and payments as CSV files.
Still stuck?
Our team answers support emails during business hours, usually within a few hours.