
Track technician and sales performance
See visits, hours, revenue, close rate and sales for each tech and salesperson, and how each number is counted.
Homeforce shows how each person on your team is producing in two places: the Technician & sales performance table on Reports, and the Sales performance card on Home.
Technician & sales performance (Reports)
Go to Reports and pick a period (7, 30, 60 or 90 days). The table lists every active team member who's dispatchable or has a technician, sales or project manager role, sorted by job revenue plus sales.
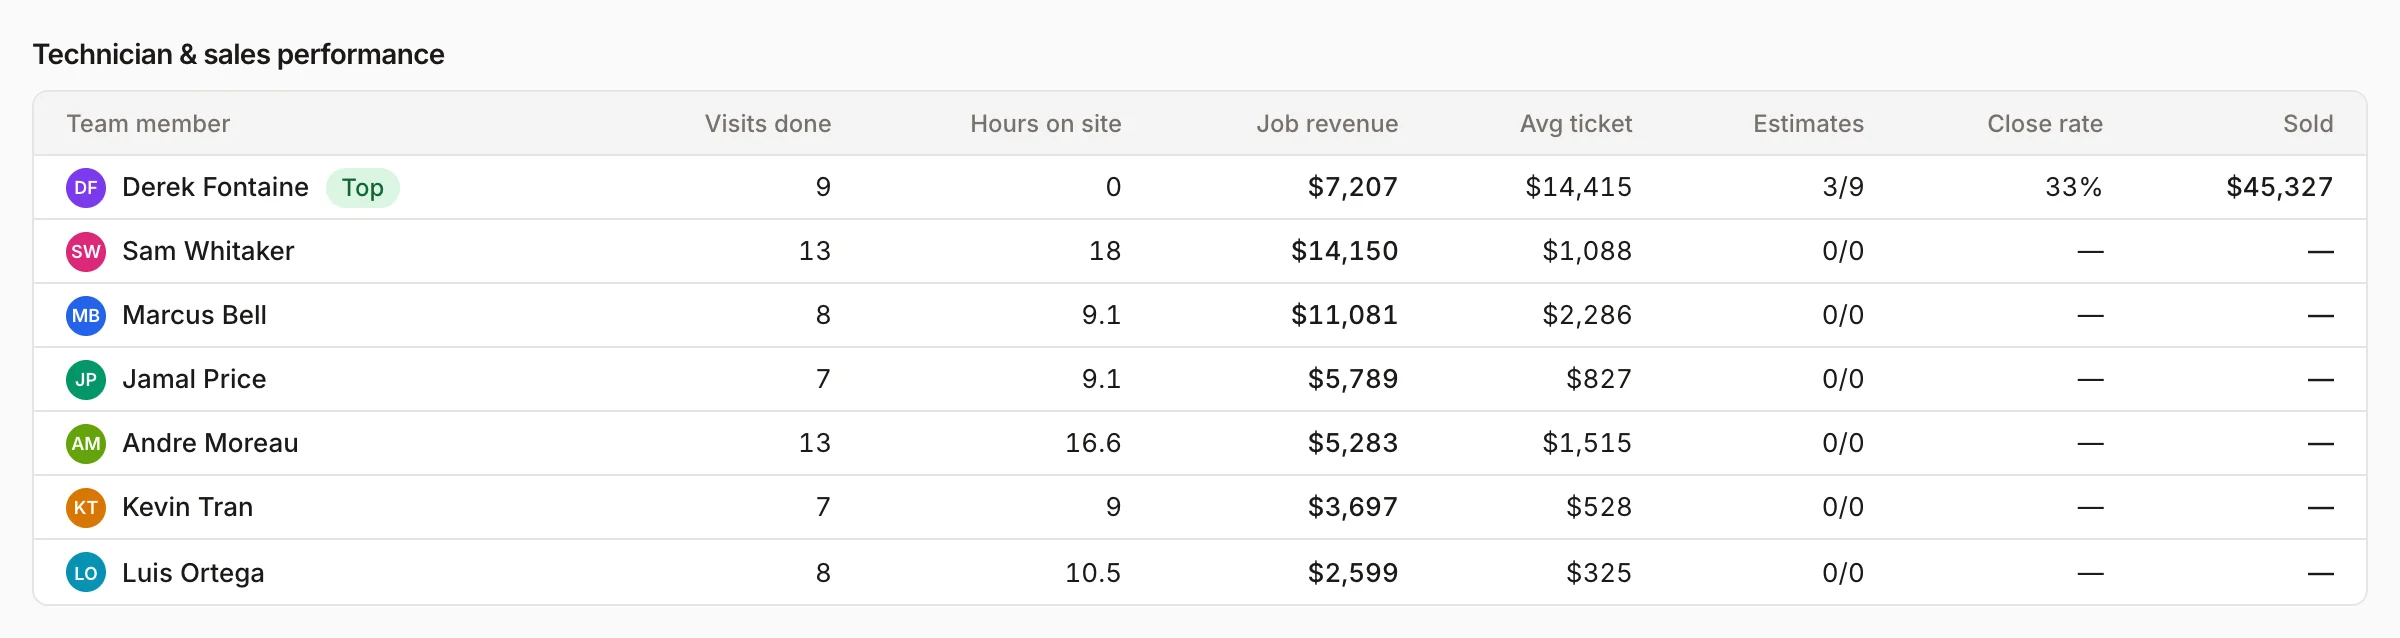
| Column | How it's counted |
|---|---|
| Visits done | Visits they were assigned to that were completed in the period |
| Hours on site | Time clocked on site in the period |
| Job revenue | Invoices issued in the period on jobs where they were the lead tech on a visit (drafts, voided and deposit invoices aren't counted) |
| Avg ticket | Job revenue divided by the number of those invoices |
| Estimates | Estimates they sold that were approved, out of those presented in the period |
| Close rate | Approved out of presented |
| Sold | The value of their approved estimates (the option the customer picked) |
The person at the top is marked Top.
Sales performance (Home)
On Home, the Sales performance card shows each rep's results for the date range you pick at the top of the page (this month, last month, last 30 days, this quarter or year to date):
- Booked: value of estimates approved in the period.
- Proposals: estimates sent in the period.
- Won: estimates approved in the period.
- Close rate: won out of decided (approved plus declined).
- Avg ticket: booked divided by won.
The close rate here counts only decided estimates, so it can be higher than the close rate on Reports, which counts every estimate presented.
Look at one person's day
On Home, use View as to see the page as a team member sees it, including their schedule for today. Choose Everyone (company) to switch back.
Who can see this
Owners, admins, office staff, salespeople, project managers and accounting users can see both. Techs don't see Reports or the Home KPIs.
For commissions and payroll, see Timesheets & Payroll in the sidebar.
Was this helpful?
Related articles
Reports
Reports overview
See revenue, invoicing, average ticket, close rate, team performance and lead source ROI for any recent period.
Reports
Use the Home dashboard
Read the KPI tiles, monthly goal, needs-attention list and schedule on the Home page, and view it as a team member.
Reports
Set monthly goals
Set a monthly revenue goal for Home, and record targets for sales, close rate, ticket size, leads and reviews.
Settings
Users and permissions
Invite people, change their role, limit sales reps to their own pipeline, and deactivate someone who leaves.
Still stuck?
Our team answers support emails during business hours, usually within a few hours.